
The towns and cities that are construction crazy
The UK housing market is currently experiencing a boom, with house prices soaring in recent months to record highs up and down the country. With demand outweighing supply, UK housebuilders are also experiencing a busy season like no other as developers scramble to cash in on the ballooning market. However, this increase in development is not equal across the country, with the sight of scaffolding, hard hats and workwear being much more common in some places than others.
While we were aware of this imbalance, we wanted to be able to pinpoint which areas were experiencing the greatest surge in building activity, and which were not. This is why we’ve gone over the figures to unearth the UK’s housing hotspots and construct the British Building Index. You’ll be able to see which cities are the best for a variety of factors from construction jobs in the area to planning application success rates, with an overall Construction Score being used to rank each location accordingly.
Demand for workwear is on the rise
One clear indicator of a building boom in the UK is an increase in the volume of workwear sold in the last twelve months compared to the previous year. Despite the pandemic, there has been +13% rise in the number of workwear items sold, indicating that more construction work is taking place. While this does not tell us much about where the sharpest rises in homebuilding are happening, it did spur us on to find out.
The ten towns and cities with the biggest building boom
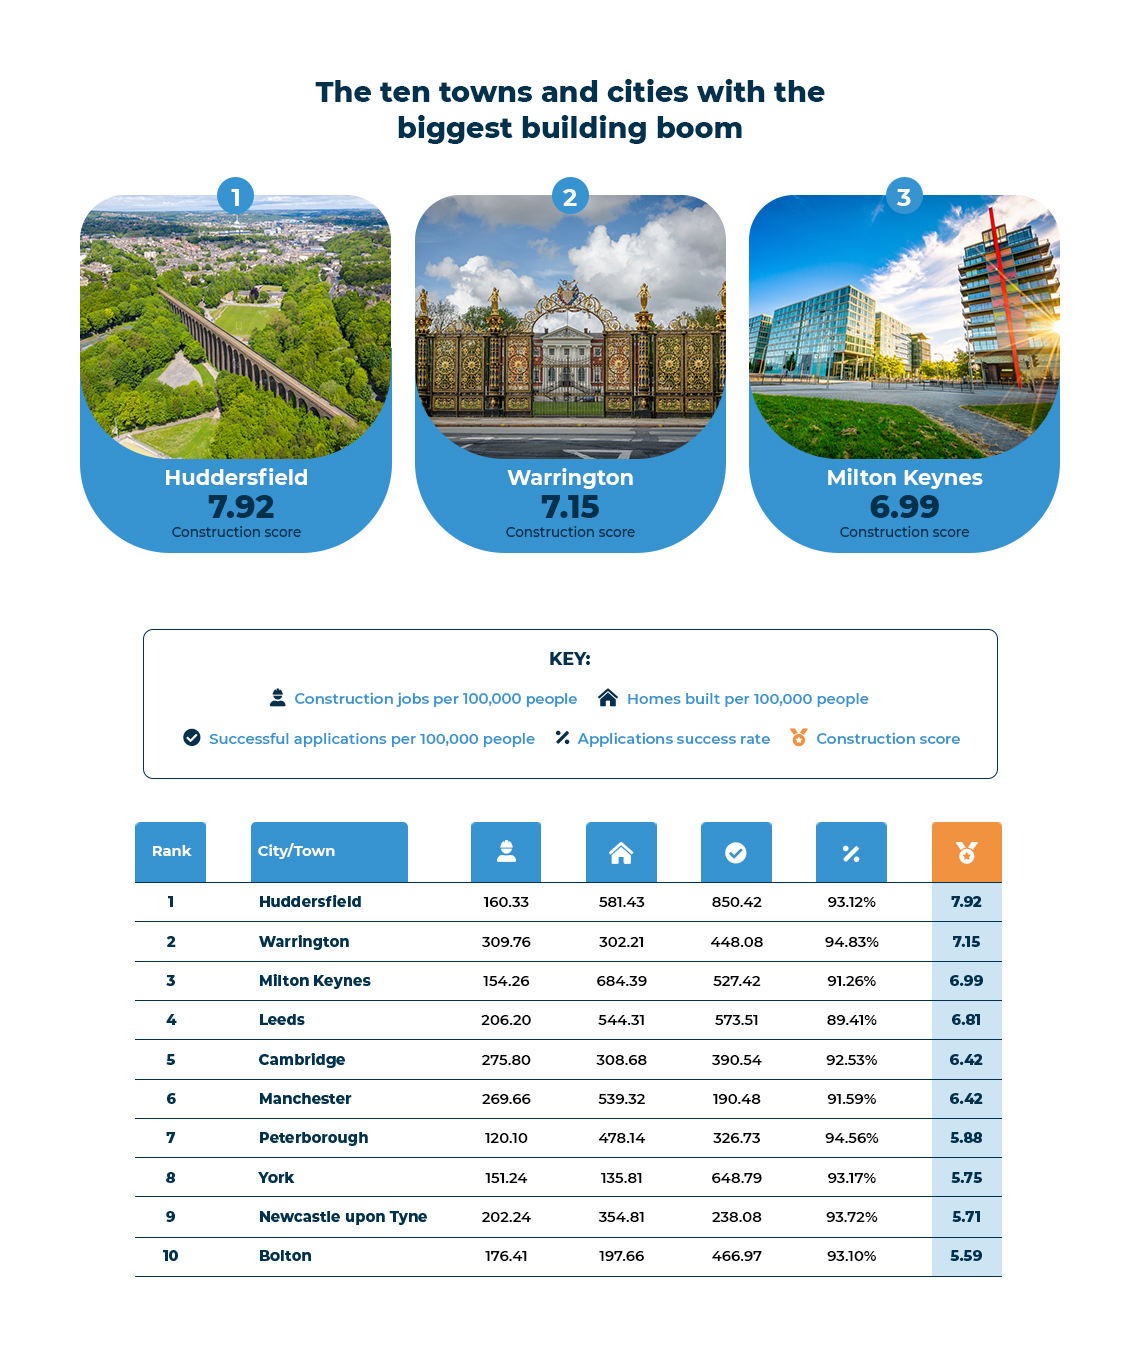
- Huddersfield Construction Score: 7.92
Huddersfield is the busiest building location in all of England, having scored an impressive 7.92 out of 10. Huddersfield and the surrounding area has a very high number of homes built per person in 2020, with 581.43 homes built per 100,000. The town also has a very high number of successful planning applications for its size, with 850.42 applications being accepted per 100,000 people.
- Warrington Construction Score: 7.15
Warrington came second overall with a Construction Score of 7.15. Warrington’s high score was supported by the huge number of construction vacancies listed in the area, as many as 309.76 per 100,000 people, while it also benefited from a very high success rate for planning applications at 94.83%.
- Milton Keynes Construction Score: 6.99
In third place is Milton Keynes with an overall Construction Score of 6.99. Milton Keynes saw an extremely high number of new houses built at 684.39 per 100,000 people while having a particularly planning permission success rate and a high number of successful applications compared to the town’s population.
The locations with the least building activity
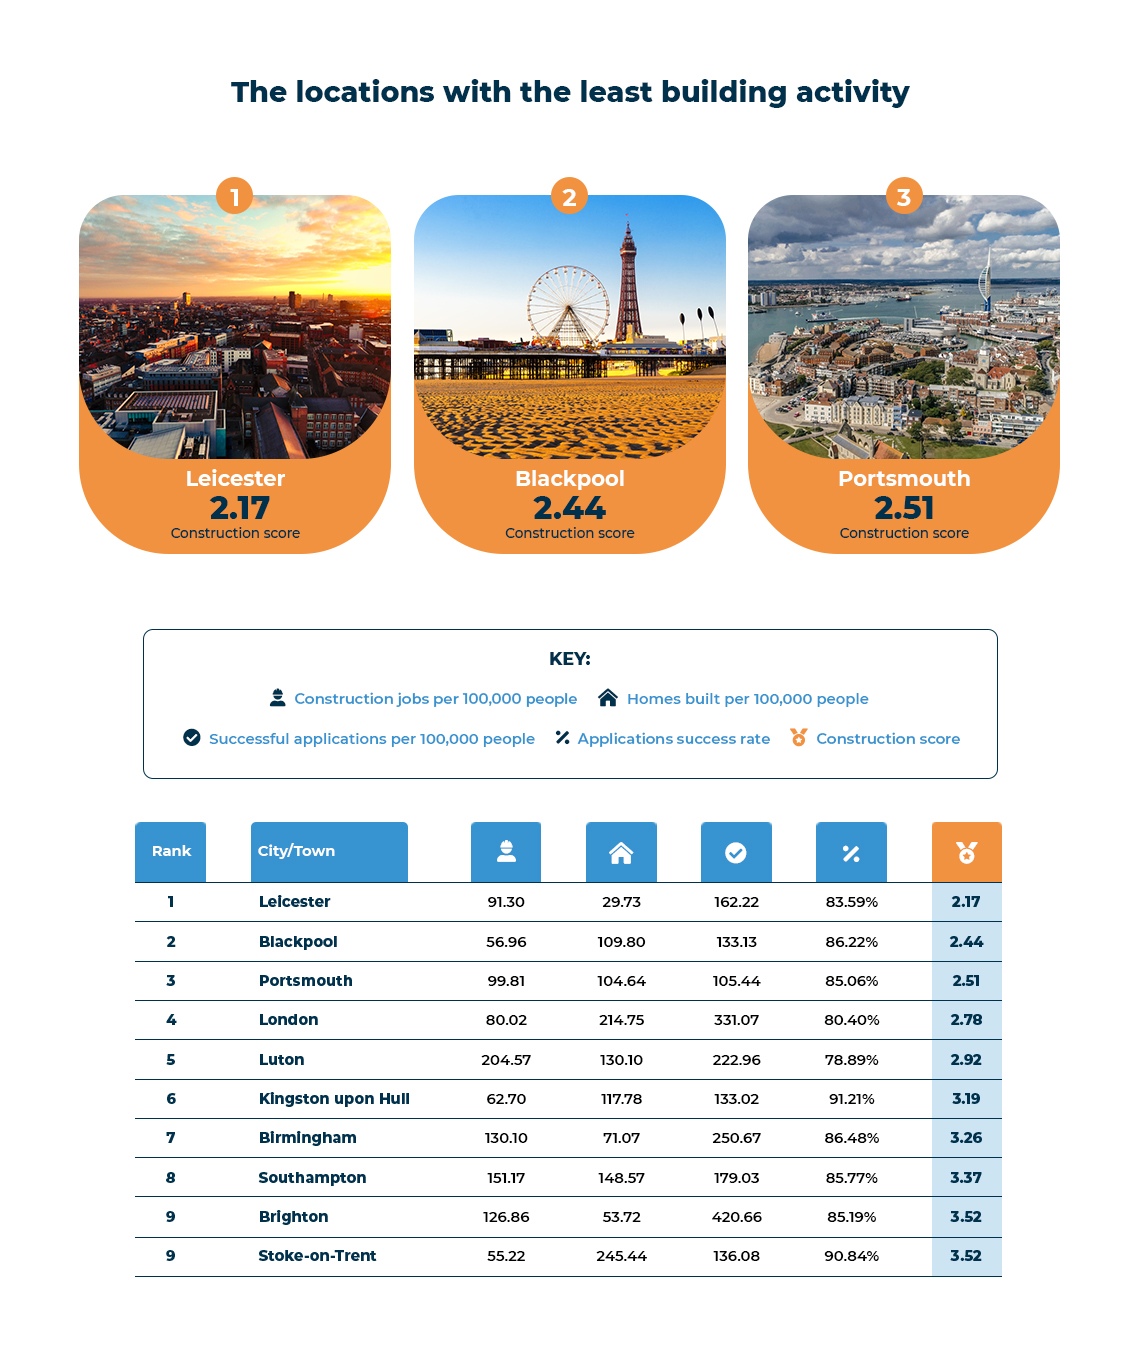
On the opposite end of the scale are the towns and cities with the lowest proportionate levels of building activity. The homebuilding efforts in these areas have been slow-moving in the past year, with little activity and few new builds coming to market.
- Leicester Construction Score: 2.17
Leicester is the city with the least building activity, having received a Construction Score of just 2.17. With low scores across all metrics, Leicester was particularly weak when it came to the number of homes built compared to the population, with only 29.73 homes per 100,000 people.
- Blackpool Construction Score: 2.44
Blackpool came second with an overall Construction Score of 2.44. While there were many more homes built per head than in Leicester, there were still only 109.80 per 100,000 people. However, Blackpool’s very low number of construction jobs available, only 56.96 per 100,000 people, shows that there is little demand for building work in the area.
- Portsmouth Construction Score: 2.51
The third lowest Construction Score goes to Portsmouth, which just beat Blackpool with a score of 2.51. Portsmouth also received low scores across the board, but this was particularly the case when it came to the number of successful planning permission applications per head, which came to just 105.44 per 100,000 people.
The locations with the most construction job opportunities
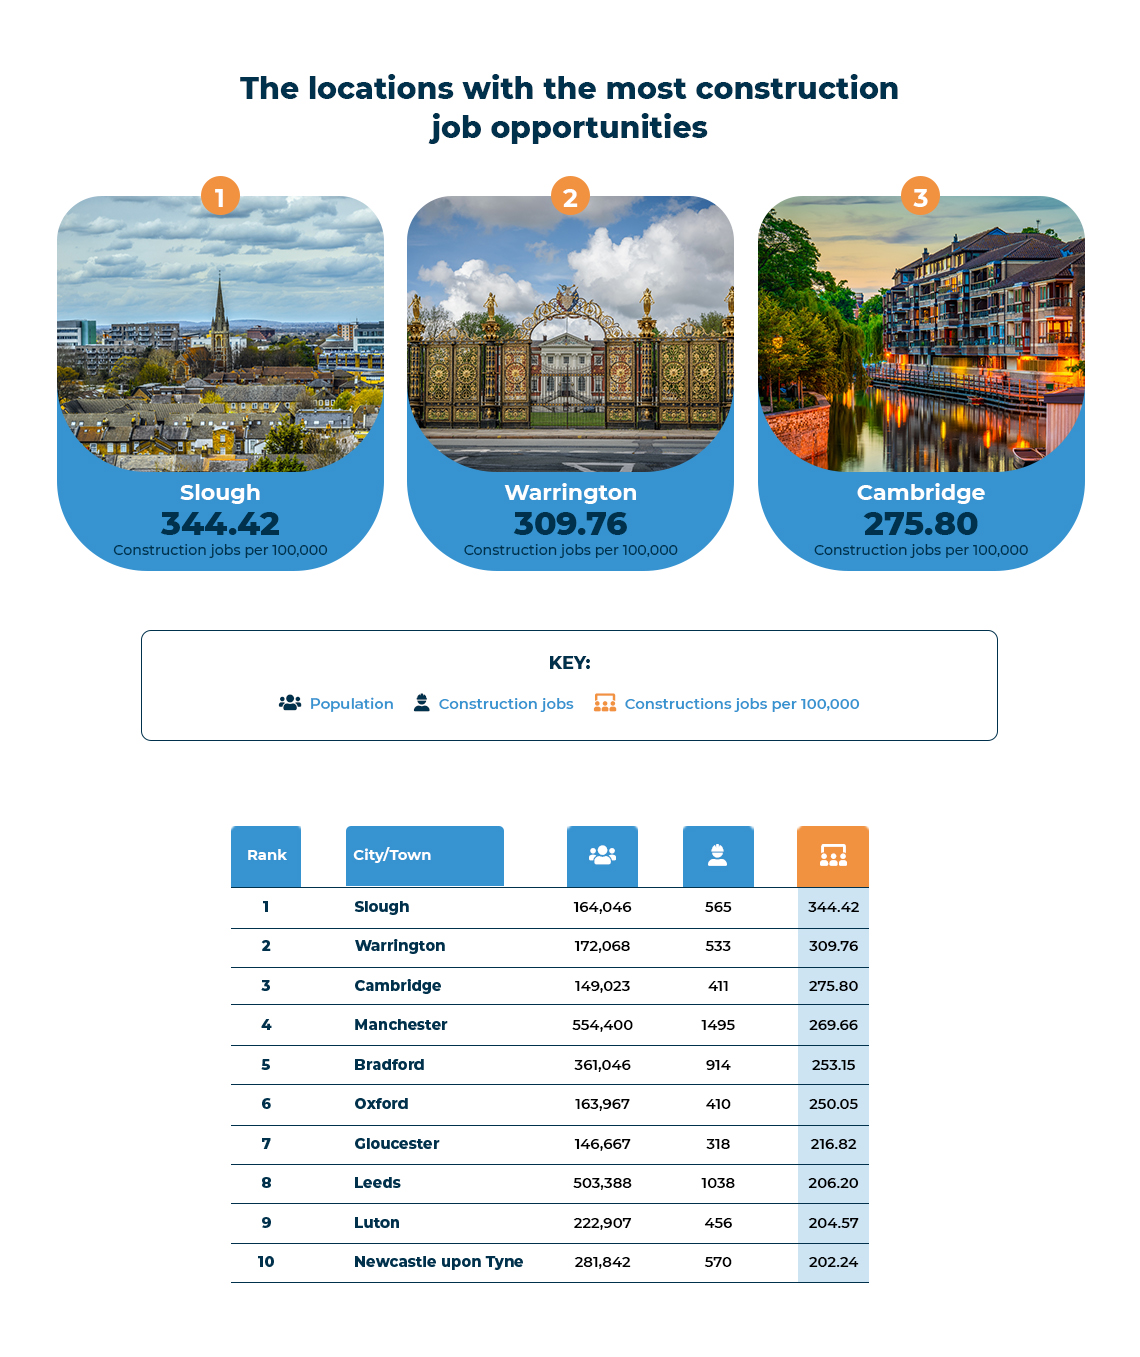
Here we focus purely on the number of construction vacancies in each location, compared to the local population. This will give us an idea of the demand for construction work in the area, with more jobs per head indicating higher demand.
- Slough Construction Jobs per 100,000: 344.42
Slough has the highest number of construction vacancies per person, with 344.42 job listings per 100,000 residents, indicating that there is high demand for building work in the area.
- Warrington Construction Jobs per 100,000: 309.76
Warrington took second place with a rate of 309.76 construction vacancies per 100,000 people.
- Cambridge Construction Jobs per 100,000: 275.80
In third place was Cambridge, where there were 275.80 job openings in construction per 100,000 residents.
The towns with the most homes built in 2020 per 100,000 people
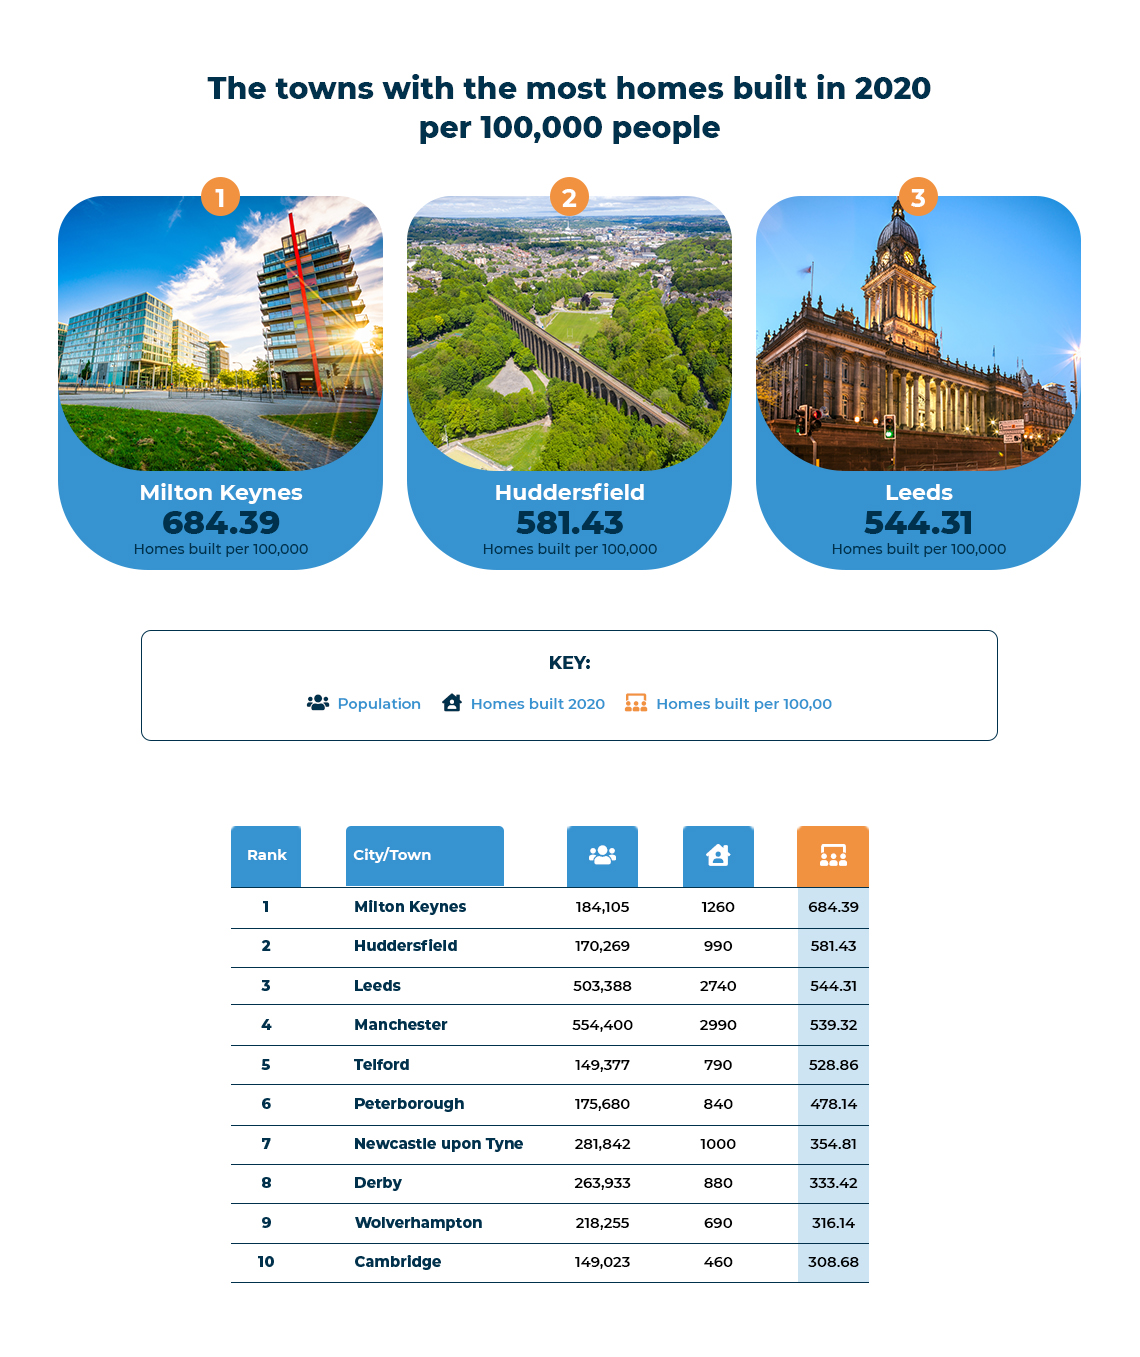
Here we can see which towns built the most homes in 2020 per head. This is one of the strongest and most obvious indicators of which areas of the country are the biggest building hotspots.
- Milton Keynes Homes Built per 100,000: 684.39
Milton Keynes had the highest number of homes built per head, with 684.39 homes constructed per 100,000 people in the town. This top rate of home building is far ahead of any other town or city on our list, indicating a strong homebuilding buzz about the town.
- Huddersfield Homes Built per 100,000: 581.43
Huddersfield had the second-highest rate of homebuilding in the country, with 581.43 homes built per 100,000 residents.
- Leeds Homes Built per 100,000: 544.31
Third place went to the city of Leeds, where there were 544.31 homes built per 100,000 people.
The cities with the most successful planning applications
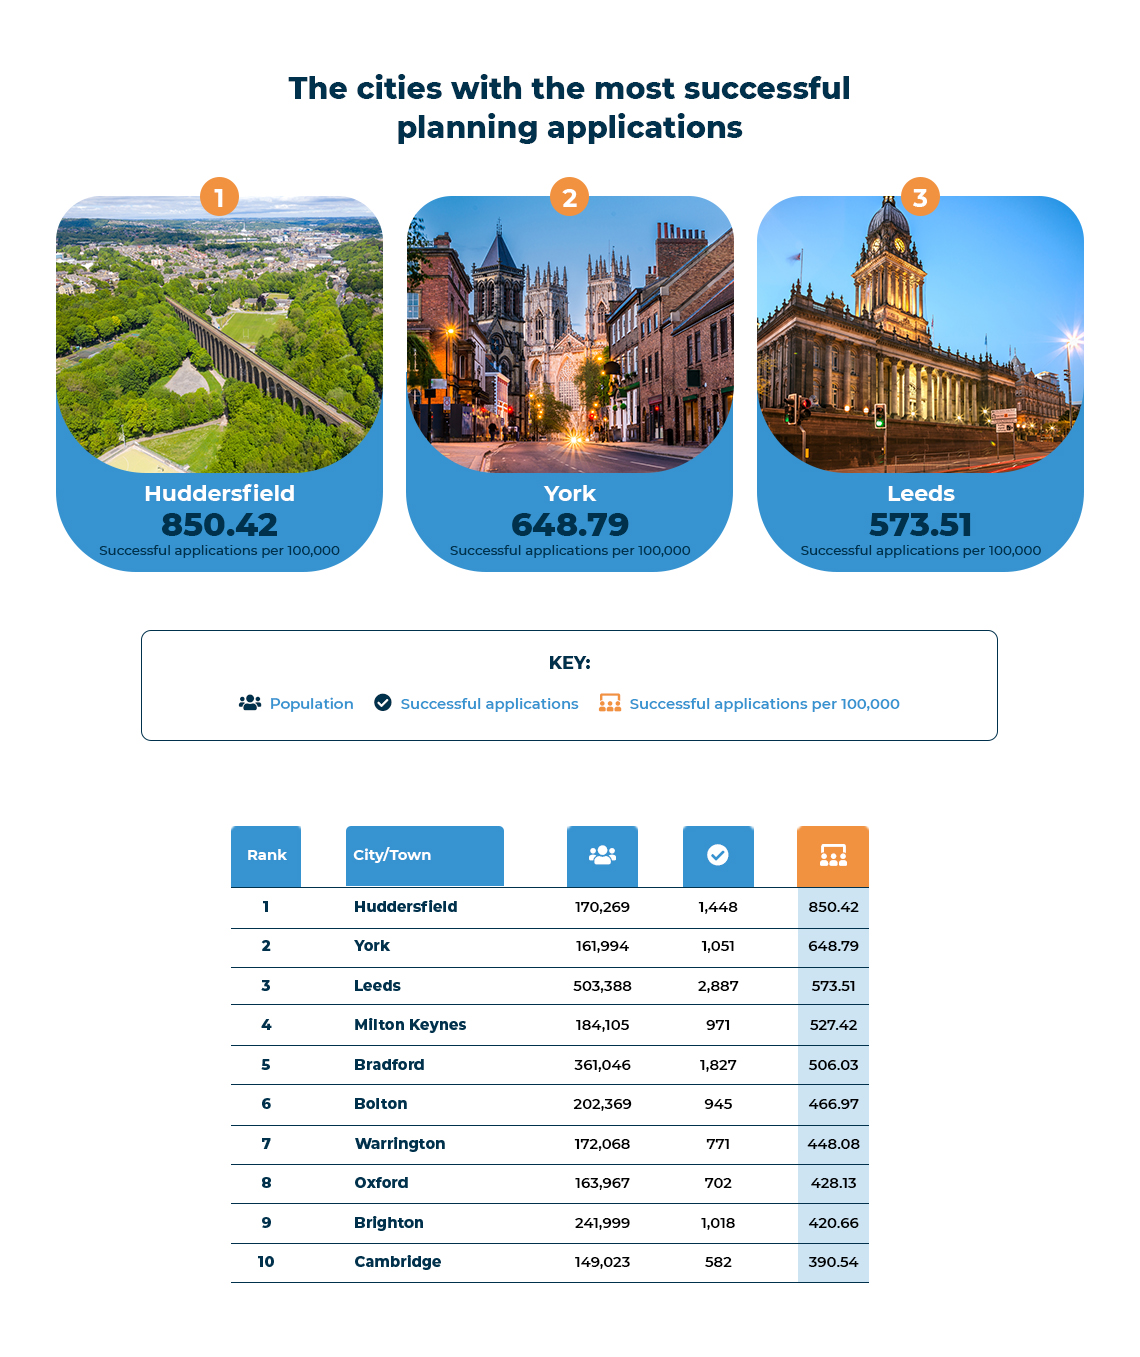
Planning applications are an important part of surveying the amount of construction interest in an area. Here we look at the number of successful applications in each town and city, comparing it to the local population so that the figures can be easily contrasted.
- Huddersfield Successful Applications per 100,000: 850.42
Huddersfield had the highest number of successful planning applications per head, with 850.42 per 100,000 people. This shows a clear interest from developers in building in the area, combined with a willingness from planning authorities to allow builds to go ahead.
- York Successful Applications per 100,000: 648.79
York came second here with 648.79 successful applications per 100,000 people in the city, showing that even picturesque tourist destinations are not exempt from the building boom.
- Leeds Successful Applications per 100,000: 573.51
With 573.51 successful applications per 100,000 residents, Leeds takes third place. This makes the top three towns for the number of accepted planning requests all in Yorkshire, making it a clear hotspot area for building activity.
The places with the highest planning permission success rates
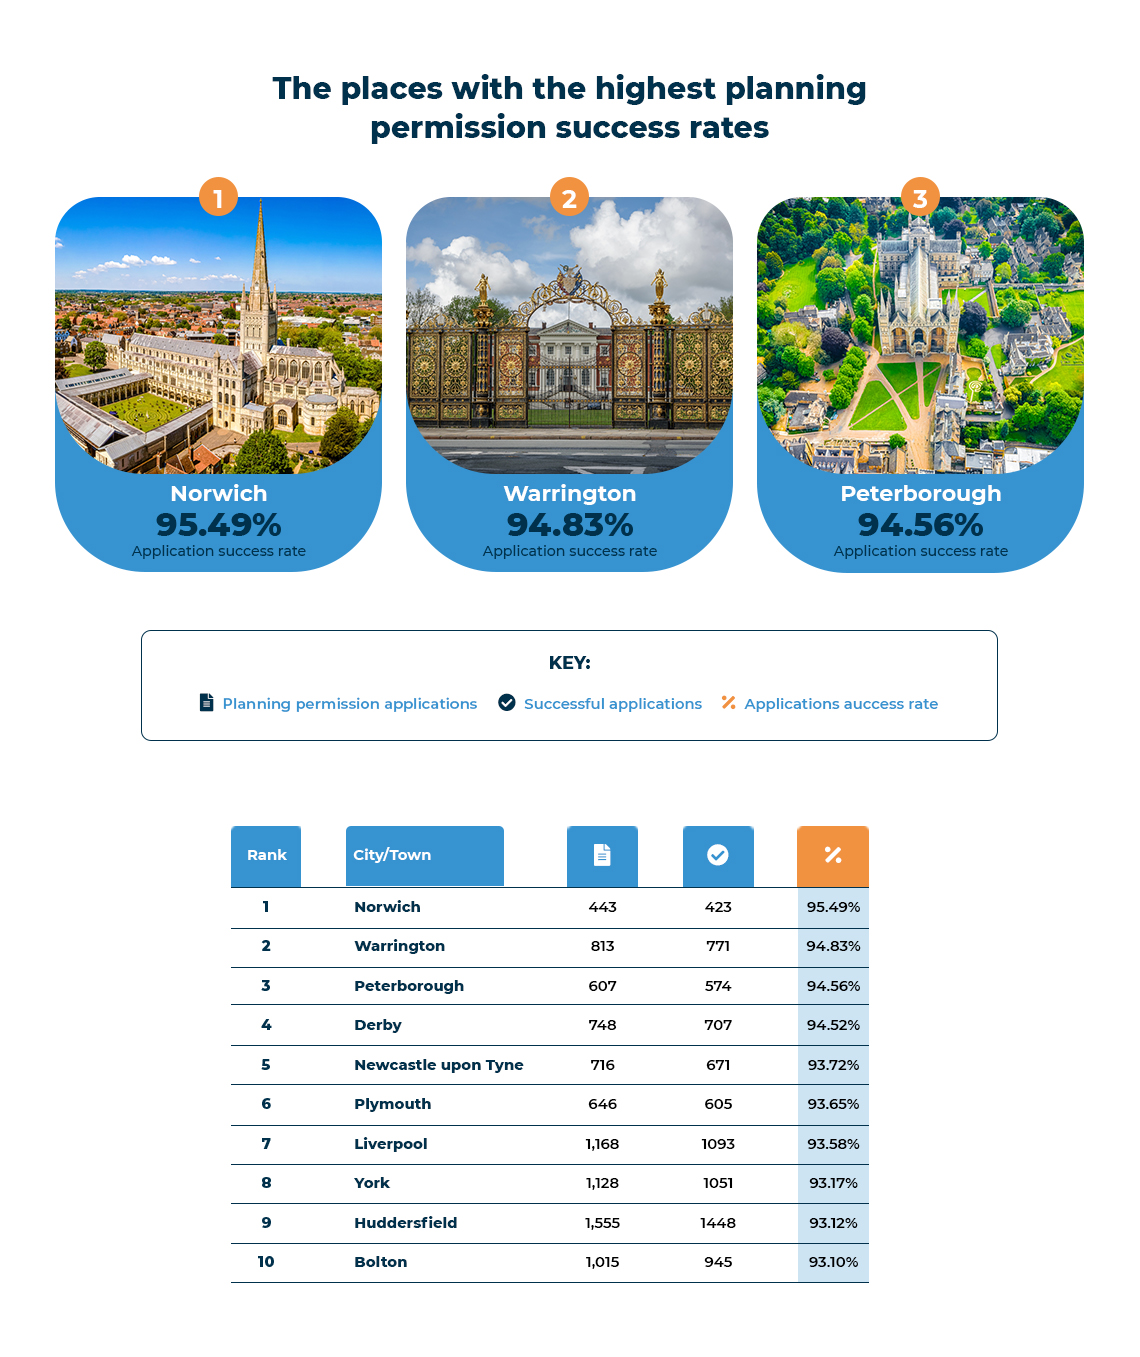
Lastly, we just look at the simple success rates of planning applications in each location, with no reference to population. This gives us a clear picture of how willing local planning authorities are to allow construction projects in the area.
- Norwich Application Success Rate: 95.49%
Norwich has the highest success rate for planning applications, standing at 95.49%. This shows that Norwich is a great place if you’re looking to build houses, as you’re more likely to get your plans approved here than anywhere else in the country.
- Warrington Application Success Rate: 94.83%
In second place, with a planning application success rate of 94.83%, is Warrington. This northern town has scored highly in other factors as well, showing it to be a busy location for building and construction work.
- Peterborough Application Success Rate: 94.56%
In third place is Peterborough, which has seen 94.56% of planning applications approved by local planning authorities. This small city is surrounded by expansive tracts of agricultural land and countryside, offering plenty of room for growth should planning authorities allow it.
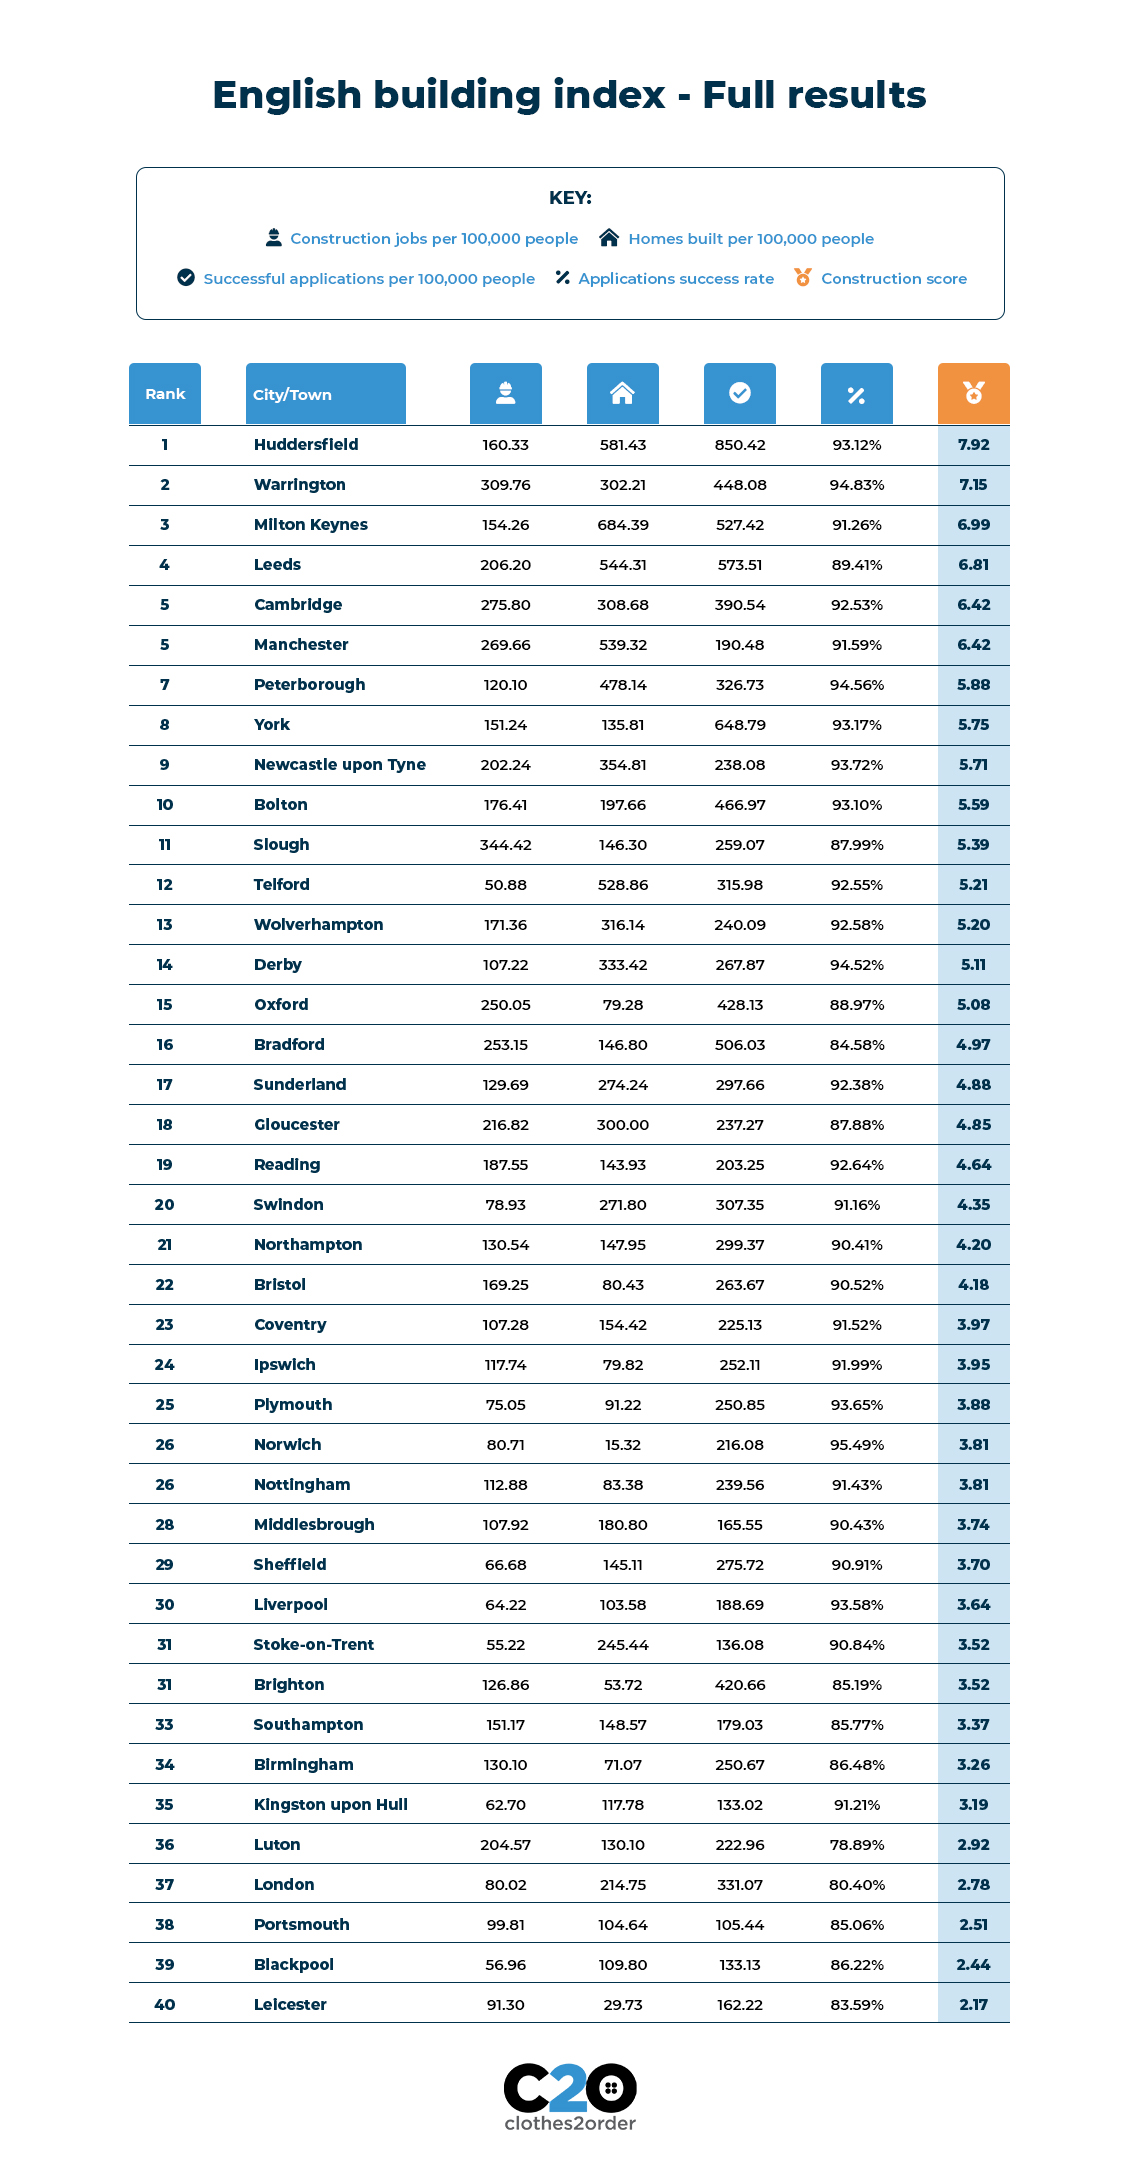
English Building Index – Full Results
Here you can see the full list of towns and cities in our study, their overall Construction Scores, and how they fared for each factor.
Methodology
We wanted to find out which parts of the country are the biggest building hotspots. To do this, we first collected a list of the largest towns and cities in the UK to use as our sample locations. Using ONS data supplied by The Geographist, we selected the 50 largest towns and cities in the country by population.
Next, we used Government data from the Ministry of Housing, Communities and Local Government to assess which towns had seen the most new build homes go up in 2020. We then used the population of each location to calculate this as a number per 100,000 people, allowing us to make comparisons between towns and cities.
To find out which locations had the highest number of job opportunities in construction, we looked at data from Indeed. For each town and city on our list, we searched for “Construction Vacancies” and set a 10-mile distance from the town to accommodate a realistic commutable distance. We then converted these figures to a rate per 100,000 people in the area so as to draw direct comparisons between locations. These figures were collected on Friday 17th September 2021.
We also collected data on the number of successful planning applications in each area, sourced from the Ministry of Housing, Communities and Local Government. We used this data for two separate factors, the first being a simple success rate of the planning applications, and the second being a rate that shows the volume of successful applications against the local population.
By combining these four factors into an equally weighted “Construction Score”, we were able to rank all of the towns and cities for their overall construction activity. Unfortunately, data was not available for all metrics for cities outside of England.
